What is data interpretation?
Data interpretation means extracting justified conclusions from tables, charts and reports by checking definitions, units, populations and comparisons before performing the requested calculation. The worked questions cover share and volume, reading a scaled table, an index is not an amount, an unequal time period, overlapping categories, a conclusion the data do not establish. Use the explained answers to check your method, then practise applying the same principles to fresh facts instead of memorising an answer sequence.
Why this skill matters
An exhibit can describe a real change without answering every question about it. Shares need totals to establish volume, indexes need a base to recover an amount, and unequal periods need a suitable exposure measure. The questions develop these distinctions using small, checkable examples. They also separate a descriptive relationship from a causal explanation that the display alone may not support.
A subject-specific method
Step 1
Read the title, unit, population and period before comparing values, and note whether the exhibit reports counts, rates, shares or indexes.
Step 2
Locate the exact row and column needed for the requested quantity rather than choosing a nearby figure because it looks relevant.
Step 3
Convert scales and time periods consistently, retaining the denominator needed for a fair comparison between groups of different sizes or exposure.
Step 4
Separate the displayed observation from a causal explanation, and identify missing inputs before making a stronger claim than the exhibit supports.
Step 5
Restate the final answer with its unit, period and population, checking that the sentence answers the original question rather than a different one.
Original worked scenario
Scenario: A report shows 400 visits and 20 sign-ups in week one, then 500 visits and 30 sign-ups in week two. Task: Choose the best supported response or conclusion. Worked answer: Conversion increases from 5% to 6%; that is one percentage point, or a 20% relative increase. Why this works: Twenty sign-ups from 400 visits is 5%, while 30 from 500 is 6%. The difference is one percentage point. Relative to the original 5% rate, the increase is 20%. The comparison assumes consistent definitions of visits, sign-ups and the reporting periods. Common trap: Do not confuse percentage points with percentage growth.
How to prepare effectively
Practise describing an exhibit before calculating from it. State what each row or axis represents and what a displayed unit means. A revenue table in thousands needs a scale conversion; a market-share chart needs the corresponding total before it can establish absolute volume. Writing those facts first can prevent an otherwise accurate calculation from answering the wrong question. Work through paired examples where totals and rates move in different directions. More enquiries over a longer period can still mean the same daily rate. A smaller product share can coexist with greater unit sales. Explain both measures and the denominators that connect them. This makes the interpretation useful instead of presenting one fact as if it disproved the other. For charts, check whether the series is cumulative, whether an axis is truncated and whether intervals are comparable. Estimate only to the precision the display permits. If exact values are available in an accompanying table, use them for a calculation requiring an exact answer. Do not present a graph reading as more precise than the source. Review each answer by distinguishing descriptive, comparative and causal claims. The survey overlap calculation establishes a count under defined categories. Two rising time series establish a pattern, not a causal effect. When an item lacks the information needed for a unique result, state what is missing. During timed practice, focus on locating the decisive definition and operation rather than narrating every visible feature of the chart.
Mistakes that reduce scores
Do not infer falling volume from falling share when totals differ, compare unequal periods without the requested exposure measure or treat an index as an absolute count. Overlapping groups require attention to double-counting. A co-moving chart supports a description of the relationship, not automatically an explanation of its cause.
Frequently asked questions
Can share fall while volume rises?
Yes. Multiply each share by its corresponding total. A growing overall total can outweigh a smaller percentage share for one category.
What does an index of 115 mean with base 100?
It represents a level 15% above the base under the index definition. It does not by itself provide an absolute quantity.
When should overlapping groups be adjusted?
When adding their counts would include the same people twice. Use the stated overlap and confirm that the groups share the same population.
How precise should a chart answer be?
Use the precision the source supports. Prefer exact accompanying table values when the question requires a calculation that a graph only approximates.
Read the display before drawing the conclusion
Data interpretation turns a table, chart or short report into a justified statement. First identify the population, period and unit. A chart of percentage shares answers a different question from a chart of absolute volumes. A fall in one category's share does not necessarily mean its volume fell when the total market grew. Read what the denominator represents before comparing bars or lines. Distinguish a change in the reported measure from an explanation for that change. A table can show that returns increased; it may not show whether product quality, delivery handling or recording practices caused it. Some interpretation questions ask only for arithmetic. Others ask which conclusion is supported. Answer the requested question without turning every visible trend into a causal story. The fictional exhibits below are deliberately small enough to calculate by hand. Larger assessment exhibits use the same habits: locate the right row and column, identify any scaling factor, select an operation and check the conclusion's scope. Keep a note of whether figures are counts, amounts, rates or indexes so that you do not mix them in one calculation.
Question 1: Share and volume
A company sells 2,000 units in year one, with Product A representing 30%. In year two it sells 3,000 units, with Product A representing 25%. Did Product A's unit sales fall? Answer: No. Its sales rose from 600 to 750 units, an increase of 150 or 25%. Its share of total sales fell by five percentage points. Both statements are consistent because the overall total grew. Do not answer an absolute-volume question from percentage shares alone when the totals differ. Write the share multiplied by its corresponding total for each period before comparing the results.
Question 2: Reading a scaled table
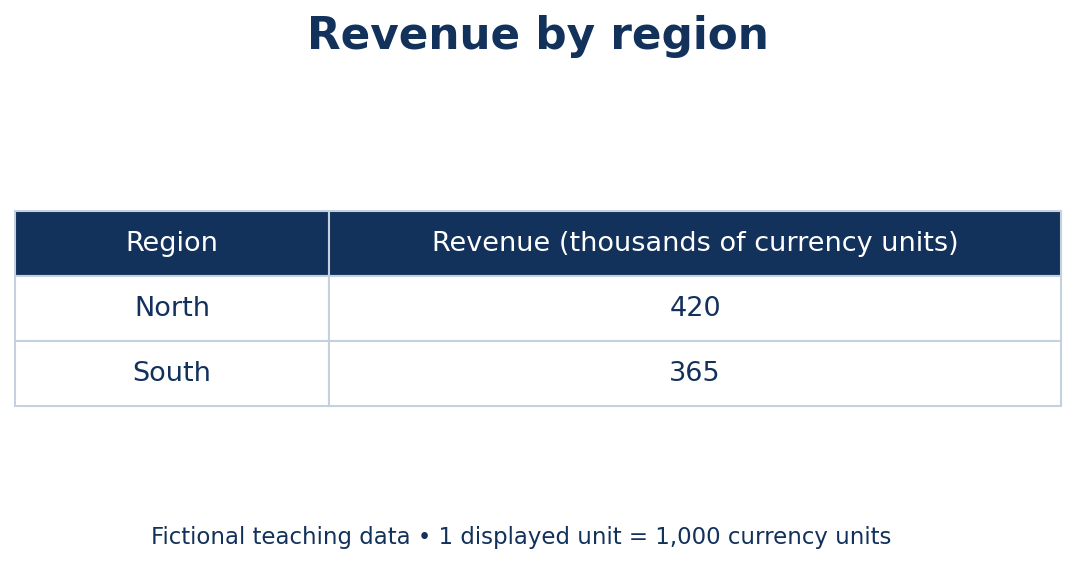
A table headed Revenue, thousands of currency units shows North at 420 and South at 365. How much higher is North's reported revenue? Answer: 55,000 currency units. The displayed difference is 55, and the heading scales each displayed unit by 1,000. The percentage by which North exceeds South would instead be 55 divided by 365, approximately 15.1%. Those answers address different questions. Check whether an assessment option uses full units or thousands before selecting it. Reporting 55 currency units would ignore the table's measurement scale.
Question 3: An index is not an amount
An output index equals 100 in the base year and 115 in the next year. What does 115 establish if the index definition is consistent? Answer: Output is 15% higher than the base-year level. It does not establish output of 115 products, revenue of 115 or an increase of 115%. The base-year amount is not supplied, so an absolute quantity cannot be recovered. If base-year output were later supplied as 8,000 units, the indexed level would correspond to 9,200. Keep relative indexes separate from physical quantities unless you have the information needed to convert them.
Question 4: An unequal time period
A report lists 900 enquiries for a 30-day month and 840 for a 28-day month. Which period has the higher average daily enquiry volume? Answer: Neither: both average 30 enquiries a day. The first total is larger only because it covers more days. This comparison uses calendar days because that is the denominator supplied. A question about enquiries per working day would require the number of working days or an explicit convention. Do not silently substitute a different denominator because it seems more realistic for a particular business.
Question 5: Overlapping categories
In a survey of 100 people, 60 use spreadsheets and 50 use databases. Thirty use both. How many use at least one of the two tools? Answer: Eighty. Adding 60 and 50 counts the 30 people in both groups twice, so subtract that overlap once: 60+50-30 = 80. Twenty use neither. The calculation assumes the groups refer to the same 100 respondents and the stated overlap is accurate. Do not apply the subtraction rule to categories that are already mutually exclusive; read the category definitions first.
Question 6: A conclusion the data do not establish
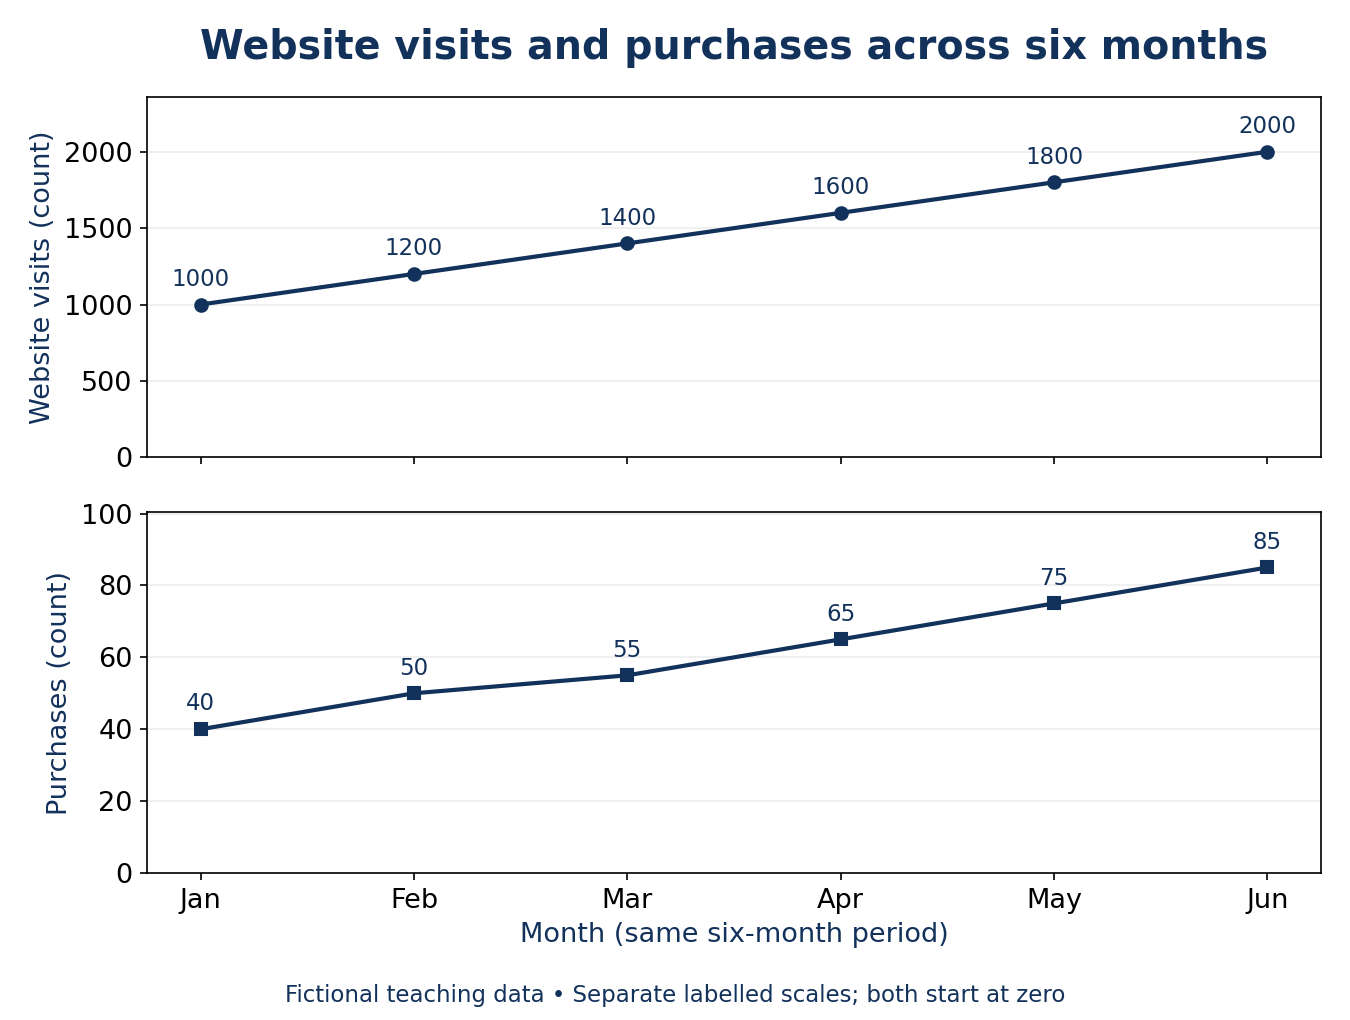
The two-panel line chart below uses fictional teaching data for January through June. Website visits are 1,000, 1,200, 1,400, 1,600, 1,800 and 2,000; purchases are 40, 50, 55, 65, 75 and 85. Both rise over the same six months. Each panel has its own labelled count scale starting at zero. Do these rising trends alone establish that increasing visits caused the increase in purchases? Answer: No. The two trends co-move, but price, promotions, seasonality, customer mix or other changes could influence purchases. Visits might contribute, but the chart does not isolate the causal effect. A supported descriptive conclusion is that both reported measures increased over the displayed period. A claim about conversion rate would require purchases divided by the appropriate visit or user denominator, using consistent definitions and attribution rules.
Avoiding misleading comparisons
When a graph seems dramatic, inspect its axis, baseline and interval spacing. A truncated axis can emphasise a small absolute difference; a cumulative total can rise even while the monthly addition is falling. A logarithmic scale changes how equal visual distances relate to quantities. You do not need to assume the chart is deceptive; you do need to understand its encoding before describing its size of change. Record uncertainty explicitly when figures are rounded or read from a graph. An approximate chart reading should not support a falsely precise answer. If the task supplies exact table values, use them instead of estimating from a picture of the same data. In practice, check the arithmetic independently and write one sentence explaining the conclusion. That final sentence often reveals whether you answered the quantity asked for or an easier nearby question.
Continue with the matching discipline
Explore the Data Interpretation assessment, using the production skill name shown on that page. Review the assessment format, current access terms and account requirements before starting. A skills assessment does not guarantee employment or a particular result.
A final practical check
As a final check, restate the answer with its unit, period and population. For example, a percentage of respondents is not automatically a percentage of all customers. This short interpretation sentence can expose a denominator or coverage mistake that the arithmetic alone would not reveal.